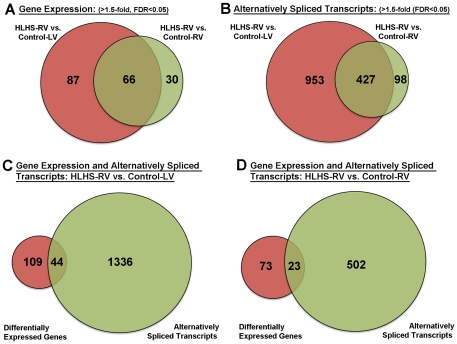
Figure 1. Venn diagrams showing the number of differentially expressed genes (A) and alternatively spliced transcripts (B) common and unique in HLHS vs. Control-LV (red) and HLHS vs. Control-RV (green) sample groups.
(C, D) Venn diagrams to indicate the number of transcripts that were differentially expressed (red) and/or alternatively spliced (green) in HLHS-RV vs. Control-LV (C) and HLHS vs. Control-RV (D) sample groups. Fold change in gene expression and splicing index >1.5-, FDR, False Discovery Rate <0.05.

