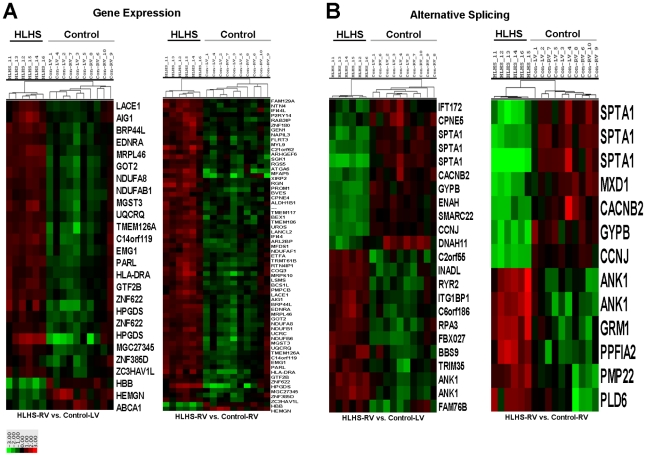
Figure 4. Hierarchical clustering and heat map analysis of differential gene expression (A) and alternatively spliced (B) profiles in HLHS-RV vs. Control-RV and Control-LV samples.
Clustering was performed on log2-transformed and normalized gene-level probe set intensities and splicing indexes for transcript clusters or exon-level probe sets, respectively, that met specific significance and fold-change criteria (see Methods). Except for the right image of panel A, all of the probe sets meeting the specific criteria are displayed. Note significant clustering of HLHS samples compared to controls that show indistinguishable identity. Key: one unit = a difference of one log2 unit from the gene (A) or splicing index (B) mean for all the samples.

