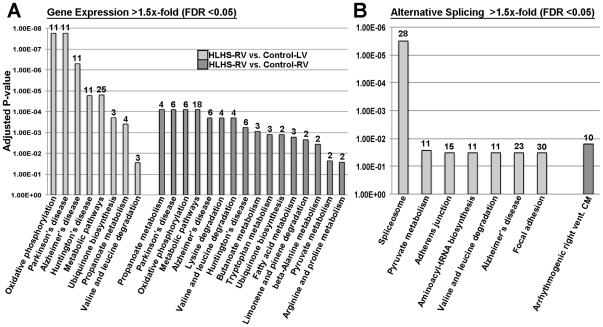
Figure 5. KEGG pathway analysis to show the relative significance of affected biological processes in HLHS-RV samples versus controls as a result of differential gene expression and alternative splicing events.
Numbers indicate the number of differentially expressed or alternatively spliced transcripts that within each indicated KEGG category.

