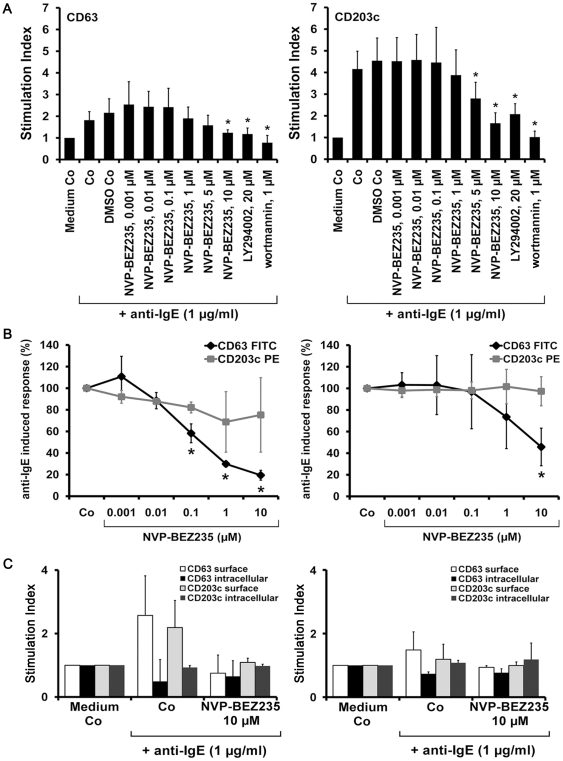
Figure 9. Effects of NVP-BEZ235 on expression of activation-linked cell surface antigens on BA and MC.
A: BA in whole blood samples were preincubated in control medium (Medium Co) or in medium containing various concentrations of NVP-BEZ235 (0.001–10 µM), LY294002 (20 µM), or wortmannin (1 µM) at 37°C for 15 minutes. Then, cells were exposed to anti-IgE antibody E-124.2.8 (1 µg/ml) for another 15 minutes (37°C). Thereafter, cells were stained with mAb directed against CD63 (left panel) or CD203c (right panel), and analyzed by multicolor flow cytometry as described in the text. BA were defined as CD203c-positive cells in all samples. Anti-IgE-induced upregulation of CD antigens was calculated from mean fluorescence intensities (MFIs) obtained with stimulated (MFIstim) and unstimulated (MFIcontrol) cells and was expressed as SI (MFIstim∶MFIcontrol). Results show SI values and represent the mean±S.D. from five normal donors (the same as shown in Figure 1A). Asterisk (*) indicates p<0.05. B: IgE-preloaded cultured MC (left panel) or IgE-preloaded lung MC (right panel) were incubated in control medium (Co) or in various concentrations of NVP-BEZ235 (as indicated) at 37°C for 40 minutes. Then, cells were incubated with anti-IgE antibody E-124.2.8 (10 µg/ml) for 30 minutes (37°C). After incubation, expression of CD63 (♦-♦) and CD203c (□-□) on MC was analyzed by flow cytometry. Results show the percent-inhibition of anti-IgE-induced upregulation of CD63 or CD203c on MC, and represent the mean±S.D. from three (cultured MC) or five (lung MC) independent experiments. Asterisk (*): p<0.05. C: Ficoll-isolated BA (left panel) and lung MC (right panel) were preincubated in control medium (Co) or with 10 µM NVP-BEZ235 at 37°C for 15 minutes. Then, cells were exposed to control medium or anti-IgE antibody E-124.2.8 (1 µg/ml) for another 15 minutes (37°C). Thereafter, cells were stained with mAb directed against CD63 or CD203c and analyzed by flow cytometry using a multicolor surface staining protocol and a cytoplasmic staining protocol. Results show SI values of surface CD63 (white bars), cytoplasmic CD63 (black bars), surface CD203c (light grey bars) and cytoplasmic CD203c (dark grey bars) and represent the mean±S.D. from three independent experiments.

