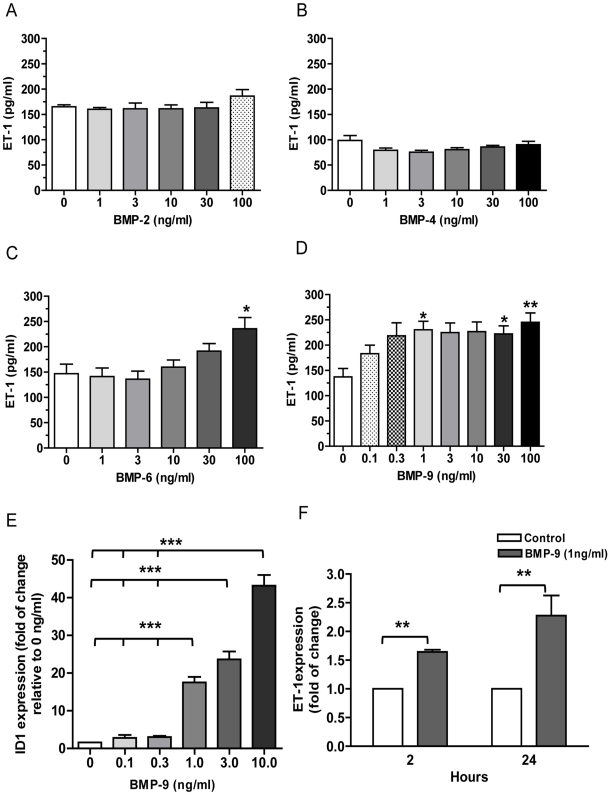
Figure 1. ET-1 release in response to BMPs and ET-1 mRNA expression by BMP-9 stimulation.
HPAECs were grown to confluence on 96-well plates or 6-well plates and starved for 16 hrs. Cells were then stimulated with various concentrations of BMP-2, n = 4 (A), BMP-4, n = 7 (B), BMP-6, n = 5 (C) or BMP-9, n = 6 (D). Supernatants were collected at 24 hrs of treatment and ET-1 level assayed by ELISA. RNA was extracted from cells treated with increasing concentration of BMP-9 for 24 hrs. Id-1 gene expression was determined by qRT-PCR and normalised to the average of 2 housekeeping genes and shown relative to expression of non-stimulated controls, n = 3 (E). RNA was extracted from cells treated with 1 ng/ml BMP-9 at 2 hrs and 24 hrs time points and ET-1 gene expression determined by qRT-PCR. ET-1 was normalised to the average of 2 housekeeping genes and shown relative to expression of non-stimulated controls at 2 hr and 24 hs, n = 4 (F). Data are presented as mean ± SEM. *p<0.05, **p<0.01, *** p<0.001.

