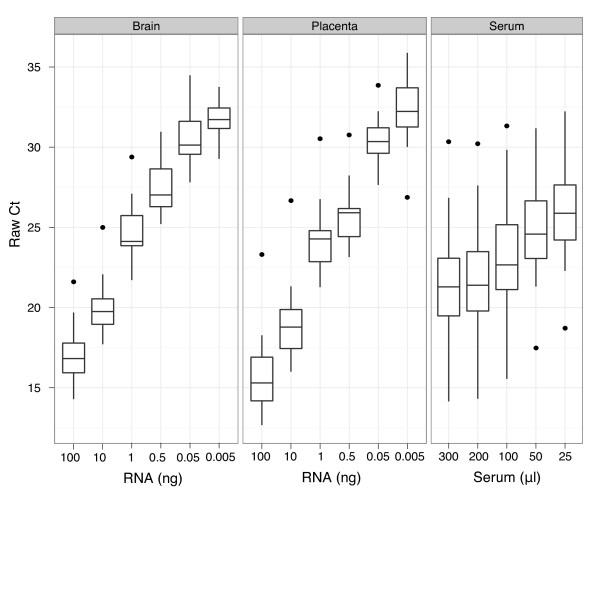
Figure 1.
Distribution of Ct values of unnormalized RT-qPCR data. The distribution of raw (unnormalized) Ct values are shown for each titration series performed with brain, placenta, and serum samples. The percent non-determined calls (Ct > 40) significantly increased with the mean Ct value of the sample.

