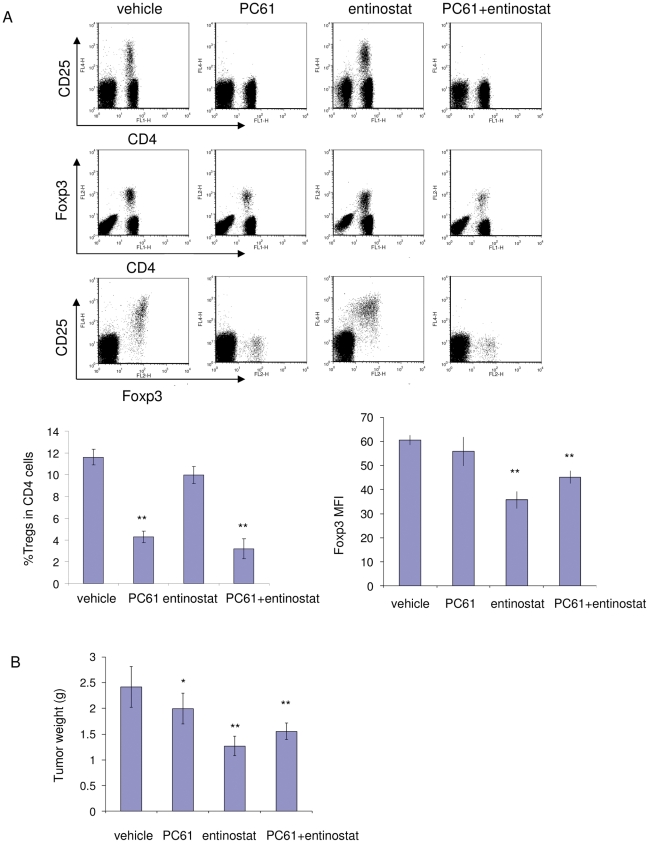
Figure 2. Antitumor activity of Tregs depletion antibody PC61 in RENCA tumor.
A, Plots show effect of vehicle, PC61, entinostat or combination treatment on CD25 and Foxp3 levels. Quantification of Tregs percentage, Foxp3 expression by FACS analysis is shown as histograms. Values are means and error bars represent S.D. for 6–7 samples per group. B, Tumor weight measurements from PC61 depletion experiment. Columns, mean grams of tumor; Bars, S.D.. n = 6–7. * represents p<0.05 for marked point vs. vehicle; ** represents p<0.01 for marked point vs. vehicle.

