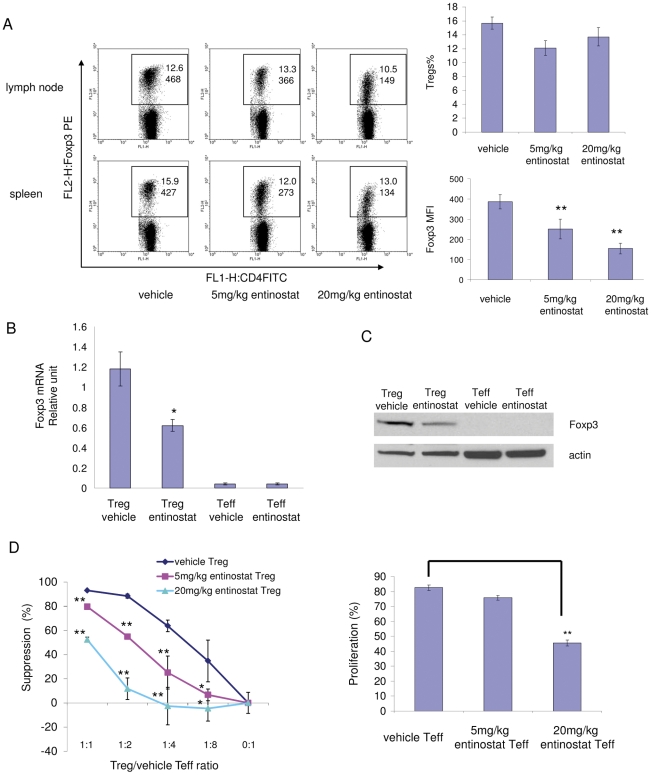
Figure 5. In vivo treatment with entinostat decreases Foxp3 expression in Tregs and inhibits Tregs function.
BALB/c mice were treated with vehicle (0.5% methocel) or 5 mg/kg/day or 20 mg/kg/day of entinostat by gavage for 5 days. Cells were harvested from spleens and lymph nodes. A, In vivo entinostat treatment decreased the expression level of Foxp3 in CD4+Foxp3+ (Treg) cells. Cells were stained with fluorescence-conjugated antibodies specific to CD4, CD25, and Foxp3 and subjected to flow cytometry analysis. The dot plots were gated for CD4+ cells. The rectangular area encloses the CD4+Foxp3+ cells, the numbers on the top represent the percentage of Foxp3+ cells. The numbers on the bottom in the area represent the mean fluorescence intensity of Foxp3 PE staining of CD4+Foxp3+ cells. The panels on the right represent quantification of Tregs percentage (top) and Foxp3 expression (bottom) in FACS analysis. Graph shows means, error bars represent standard deviations for 6 samples in each group. p = 0.00078 for 5 mg/kg entinostat vs. vehicle; p = 0.000004 for 20 mg/kg entinostat vs. vehicle; p = 0.0038 for 20 mg/kg entinostat vs. 5 mg/kg entinostat. α = 0.05. Results are representative of three separate experiments. B, In vivo entinostat treatment reduced Foxp3 mRNA levels in isolated Tregs. Total RNAs were extracted from isolated CD4+CD25+ T cells (Tregs) and CD4+CD25− T cells (Teffs) and were analyzed for Foxp3 mRNA by real time RT-PCR. Foxp3 mRNA levels were normalized to GAPDH mRNA (or ribosomal RNA RPL13A) and values represent means for three samples (three mice per sample) per group and have relative units. p = 0.0157 for Tregs treated with entinostat vs. Tregs treated with vehicle. Results are representative of three separate experiments. C, In vivo entinostat treatment reduced Foxp3 protein level in Tregs. Total cell protein was extracted from isolated Tregs and Teffs and was analyzed for Foxp3 protein by Western blot. D, The effects of HDAC inhibitor, entinostat, on Tregs suppressive function and Teffs proliferation. Tregs suppression assays: 2×10⁵ CFSE-labeled Teffs were stimulated with 0.5 µg/ml of anti-CD3ε antibody and 4×10⁵ irradiated antigen presenting cells (CD4 cells-depleted splenocytes) and co-cultured with Tregs in different ratios to Teffs for 62–80 hrs. Percentages of divided Teffs were calculated at all ratio points for each treatment. Percentage of suppression of Teffs dividing was calculated for each point by comparing cell dividing at each ratio to the cell dividing in absence of Tregs (0∶1). Left panel: Effect of entinostat treatment on Tregs function. Right panel: Effect of entinostat treatment on proliferation of Teffs. Histogram shows percentage of divided Teffs without Tregs. Data are representative of three separate experiments. Values are means from triplicate measurements. * represents p<0.05 for marked point vs. vehicle; ** represents p<0.01 for marked point vs. vehicle.

