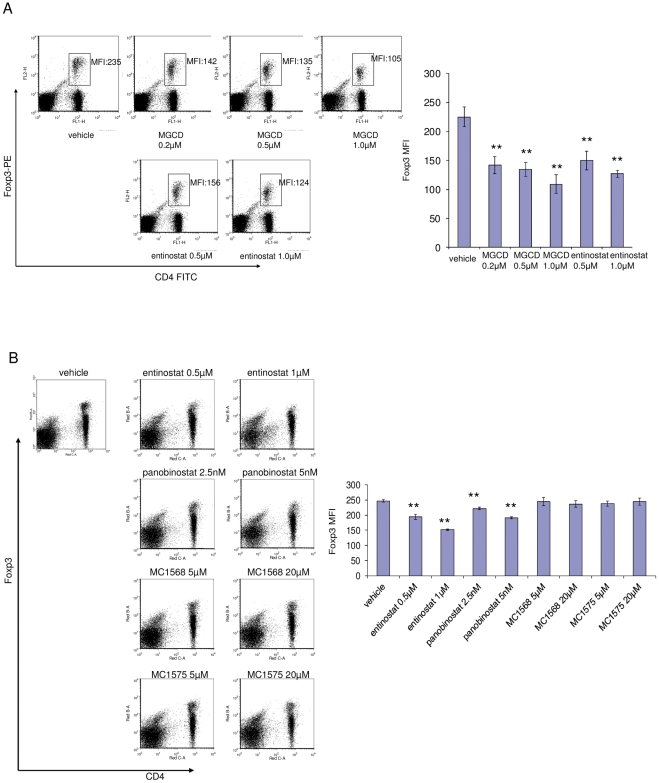
Figure 7. Class I inhibition, not class II inhibition suppresses Foxp3 expression in Tregs.
Splenocytes were isolated from BALB/c mice and put in culture with different treatment conditions as indicated for 24 hours. Cells were harvested, stained for surface markers and intracellular Foxp3, and subjected to FACS analysis. Plot gating and parameter indication were described in Figure 1. Histograms show quantification of Foxp3 levels in Tregs. A, Both class I HDAC inhibitors, entinostat and MGCD0103, inhibit Foxp3 expression in Tregs. When comparing entinostat with MGCD0103, PE conjugated anti-Foxp3 antibody was used. B, Class I HDAC inhibitor, entinostat, and a pan inhibitor, panobinostat, but not class II HDAC inhibitors, MC1568 and MC1575, inhibit Foxp3 expression in Tregs. When comparing entinostat with class II HDAC inhibitors and the pan inhibitor, panobinostat, the Alexa 700 conjugated anti-Foxp3 antibody was used since other fluorochrome channels are interfered by the autofluorescence of the class II HDAC inhibitors. ** represents p<0.01 for marked treatment vs. vehicle.

