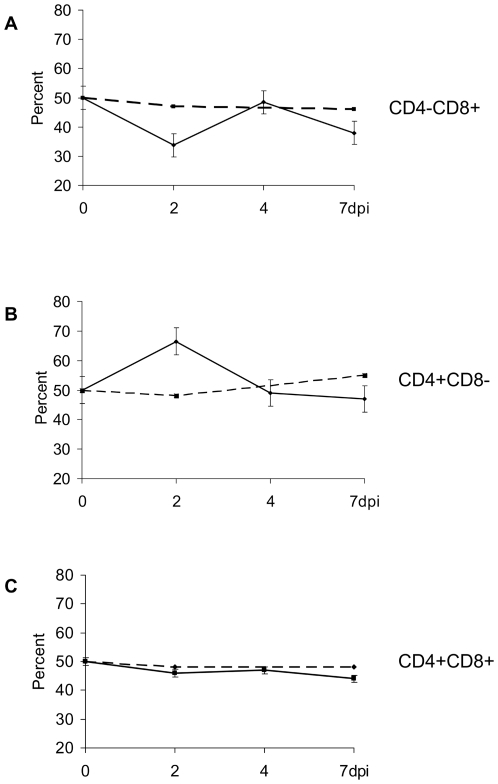
Figure 7. T cell subpopulation frequencies in NiV infected pigs during the acute phase of the infection.
Changes in CD4D8 cell subpopulation frequencies in PBMC of pigs infected with NiV based on flow cytometry analysis. The values obtained at 0 dpi were arbitrarily set at 50%. The data (mean and standard error) are based on six infected (solid line) and 4 control (dashed line) animals. Notably, significant changes with opposite trends were observed for CD4−CD8+ T cells ( Fig. 7.A ), and CD4+ CD8− T cells ( Fig. 7.B ). The changes in CD4+CD8+ T cell frequency, although statistically significant, were only minor, perhaps with slight decline toward the 7 dpi in the infected piglets compared to the controls ( Fig. 7.C ).

