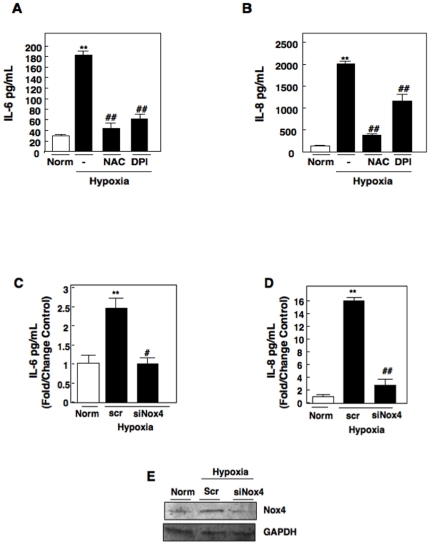
Figure 2. Effects of antioxidants on Hypoxia induced IL-6 and IL-8 production in RCC cells.
A) Interleukin-6 (IL-6) and B) Interleukin-8 (IL-8) secretion was measured using ELISA analysis in RCC 786-O cells pretreated for 30 min in buffer alone (-), N-Acetyl-L-cysteine (NAC) or a flavoprotein inhibitor (DPI) and exposed to normoxic (norm) or hypoxic conditions for 48 hrs. The data were quantitated from three independent experiments and the results are expressed as the means + S.E. **, p<0.01 versus norm and ##, p<0.01 versus hypoxic control (-). C) IL-6 and D) IL-8 secretion was measured using ELISA analysis in RCC 786-O cells transfected with scrambled control (Scr) or small interfering RNA to Nox4 (siNox4) exposed to normoxic (Norm) or hypoxia for 48 hrs. The data were quantitated from three independent experiments and the results are expressed as the means + S.E. **, p<0.01 versus norm, #, p<0.05, and ##, p<0.01 versus hypoxic scr control. E) RCC 786-O cells transfected with scrambled control (Scr), small interfering RNA to Nox4 from C, D were analyzed by Western blot with Nox4 antibody or GAPDH control.

