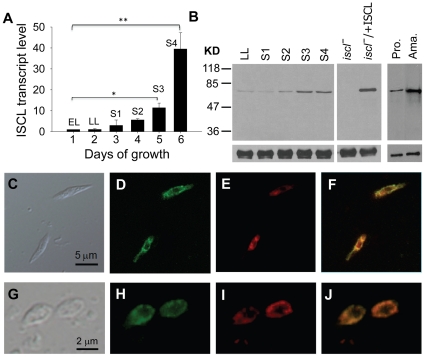
Figure 1. Temporal and spatial expression of ISCL in L. major.
(A) Elevated ISCL transcript level in stationary phase promastigotes. L. major WT promastigotes were cultured in M199 medium at a starting density of 1.0×10⁵ cells/ml and total RNA was extracted daily. The relative abundance of ISCL mRNA was determined by quantative RT-PCR using the constitutively expressed rRNA45 gene as an internal control. EL: early log phase culture (1–2×10⁶ cells/ml); LL: late log phase culture (6–10×106 cells/ml); S1–S4: day 1–4 stationary phase culture (2.0–3.0×10⁷ cells/ml). *: p<0.05, **: p<0.01. Error bars represent standard deviations from two independent experiments. (B) Increased expression of ISCL protein in stationary phase promastigotes and lesion amastigotes. Left: whole cell lysates from WT late log phase promastigotes (LL), day 1–4 stationary phase promastigotes (S1–S4), and late log phase promastigotes of iscl− and iscl−/+ISCL were subjected to immunoblot analysis using the affinity purified anti-ISCL antibody (top) or an anti-α-tubulin antibody as loading control (bottom). Right: immunoblot of cell lysates from WT day 3 stationary phase promastigotes (S3 pro.) and lesion amastigotes (ama.). Each lane contained material from 1×10⁶ cells. (C–J) Localization of endogenous ISCL in L. major. WT promastigotes (C–F) and amastigotes (G–J) were fixed and permeabilized with ethanol as described in Materials and Methods . Cells were then labeled with rabbit anti-ISCL antibody, followed by staining with goat-anti-rabbit IgG-FITC (D, H) and Mitotracker Red 580 (E, I). (F) Overlay of D and E. (J) Overlay of H and I. Control cells that were labeled with secondary antibody only did not show any green fluorescence (data not shown). Experiments in C–F were performed three times and results from one representative set are shown here.

