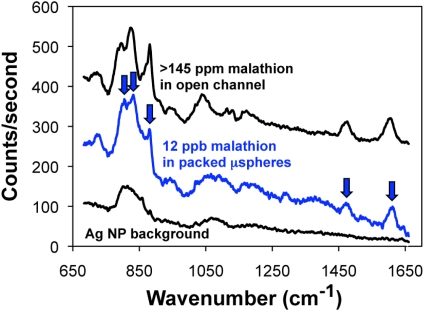
Figure 7.
Recorded SERS spectra for greater than 145 ppm malathion in water (the solubility limit) in an open microfluidic channel and for 12 ppb malathion in water in the 3D nanofluidic channel. Arrows indicate the Raman peaks for malathion. The background signal is also shown to enable the clear identification of the malathion Raman peaks.

