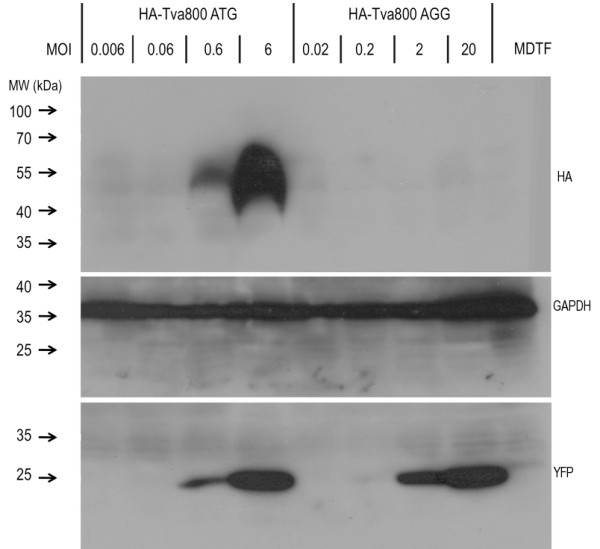
Figure 2.

Analysis of Tva800 expression in transduced cells. MDTF cells were seeded in 60 mm dishes and transduced at the MOI (i.u./cell) shown with HA-Tva800ATG or HA-Tva800AGG. Cells were grown to confluence over 3 days, lysed with loading buffer, denatured and separated on a gel and examined by Western blotting, probing with firstly anti-HA, and secondly anti-GFP on the same gel. The blot was stripped and probed for GAPDH to check for comparable input lysate levels. Markers for molecular weight are shown on the left in kDa.
