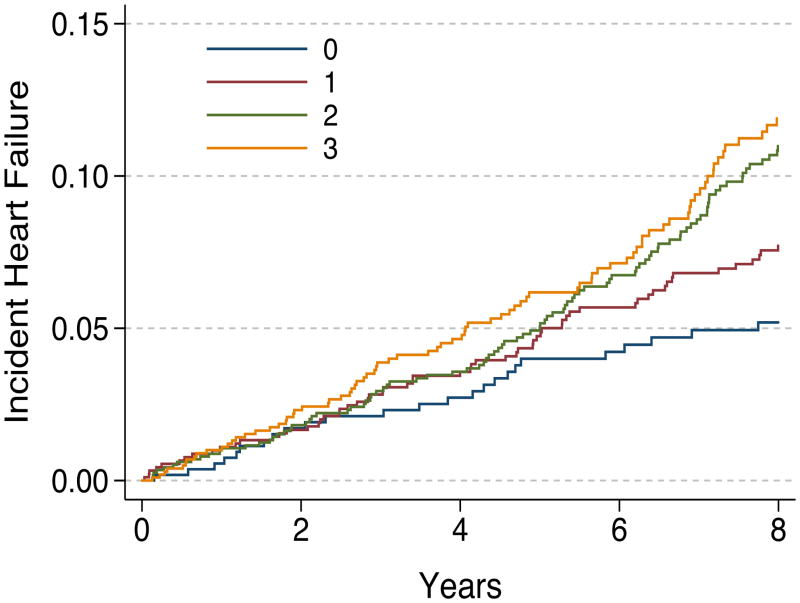
Figure 1. Heart Failure Rates According to the Number of Elevated Inflammatory Markers at Baseline.
Adjusted Kaplan-Meier plots illustrating cumulative heart failure incidence among Health ABC Study participants according to the number of elevated inflammatory markers (interleukin-6, tumor necrosis factor alpha, or C-reactive protein) at baseline. Adjustment model included all baseline characteristics as described in Table 1.

