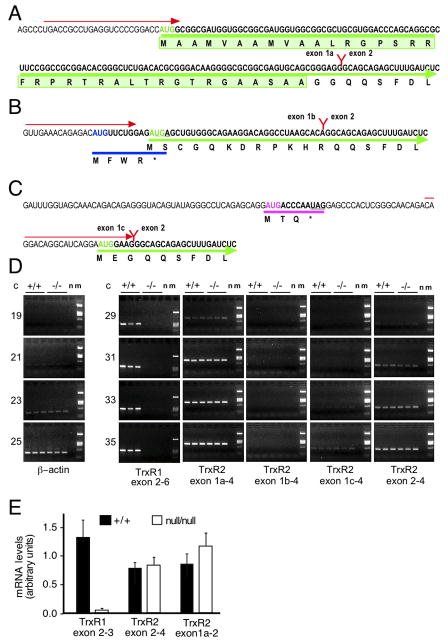
Fig. 1. Expression of TrxR1 mRNA and alternative splice-forms of TrxR2 mRNA in livers of normal and txnrd1cond/null;albCre1 mice.
(A) Structure of mitochondrial splice-form of TrxR2 mRNA. mRNA sequence is shown in black with the first AUG in green font. The heavy green line under the sequence initiating at this AUG is the N-terminal protein-coding region, with the a.a. sequence indicated below. The light green highlighted box is the 39-a.a. mitochondrial transit peptide. The exon 1a/2 splice-junction is noted with a red “Y”, and is labeled. The red arrow above the mRNA sequence indicates the sequence and orientation of the exon 1a-specific primer used for RT-PCR and qPCR. (B) Structure of alternatively initiated/spliced exon 1b-containing transcript. Symbols are as above. In addition, the first AUG, which is in the +1 reading frame from TrxR2, is blue, as is the heavy line denoting the 4-a.a. ORF this initiates. The stop codon for this ORF, which overlaps the second AUG, is underlined. (C) Structure of alternatively initiated/spliced exon 1c-containing transcript. The first AUG, which is in the +2 reading frame from TrxR2, is lavender, as is the heavy line denoting the 3-a.a. ORF this initiates. (D) Semi-quantitative RT-PCR analysis of mRNA levels for β-actin, TrxR1, and TrxR2 mRNA isoforms in mouse livers. Total RNA was prepared from three wild-type (+/+) and three mutant (−/−) P28 mice and oligo(dT)-primed cDNAs were prepared. Semi-quantitative RT-PCR was performed using the primers indicated below images and the number of PCR cycles indicated in columns labeled “C”. Images show ethidium bromide-stained gels. All six samples were analyzed with each primer set; the hepatocyte genotypes are indicated above images. Other abbreviations: n, no-template control; m, molecular size markers. (E) Expression of mRNAs encoding TrxR1 and TrxR2 were quantified by qPCR performed on equivalent amounts of oligo(dT)-primed first-strand cDNAs from wild-type (hepatocytes txnrd1+/+) and txnrd1cond/null;albCre1 (hepatocytes txnrd1null/null) mouse livers. Data were normalized to qPCR signals for β-actin mRNA in each sample. Bars represent mean and S.E.M. from three mice of each genotype. Below each column of gel images, the cDNA region spanned by the PCR reactions is indicated.

