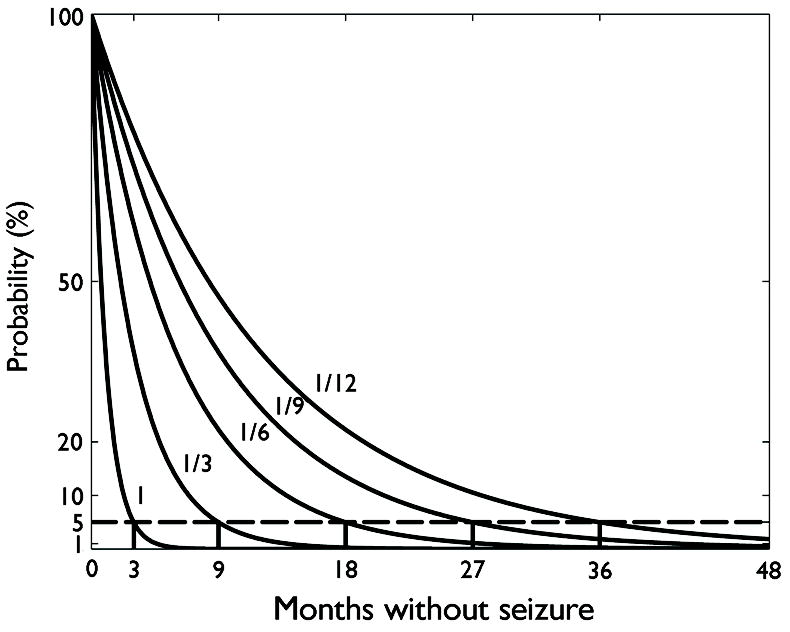
Figure 2.

Illustration of the statistical reasoning underlying the Rule of Three as originally formulated. Solid curves show the probability of experiencing a period of seizure freedom (interseizure interval) vs. time, for underlying seizure rates of 1 per 1,3,6,9, or 12 months. The interseizure interval duration for which the probability drops to 5% (dashed line) is marked. As shown, this duration is roughly three times the average interseizure interval.
