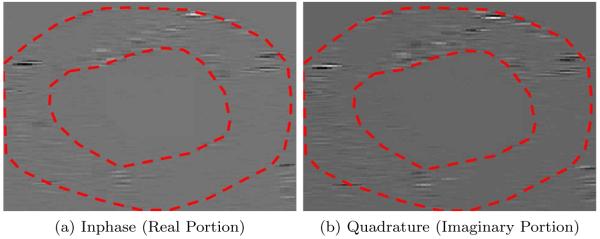
Figure 2.
Slice of 3D analytic image containing myocardium and blood pool (vertical is axial direction and horizontal is angular). Manual segmentation overlaid to aid in visual inspection. Note that the analytic image has not been log-compressed to reduce the dynamic range for visualization purposes (unlike B-mode data).

