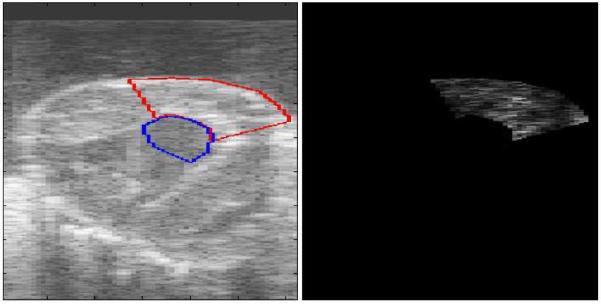
Figure 4.

Magnitude of residues calculated over region of interests in the blood pool and myocardium. The regions of interest are displayed on B-mode left in frustum coordinates (left). The image showing the absolute residues (right) contains differing patterns in the residues for the predictors over the blood pool and myocardium. The scale has been chosen such that the lighter regions represent smaller residues and, thus the more coherent signal.
