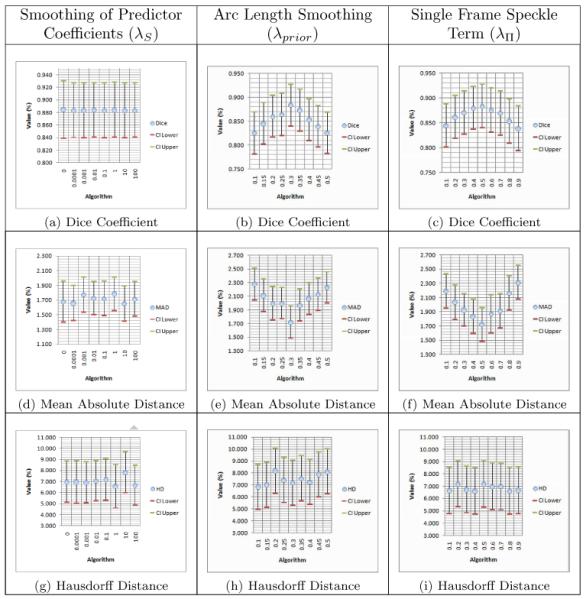
Table 1.
Means with 95% lower and upper confidence interval of quality measures obtained by varying weights of priors. The columns correspond to λS, λprior, and λΠ while the rows correspond to the Dice coefficient, mean absolute distance, and Hausdorff distance. (n = 10)

|
