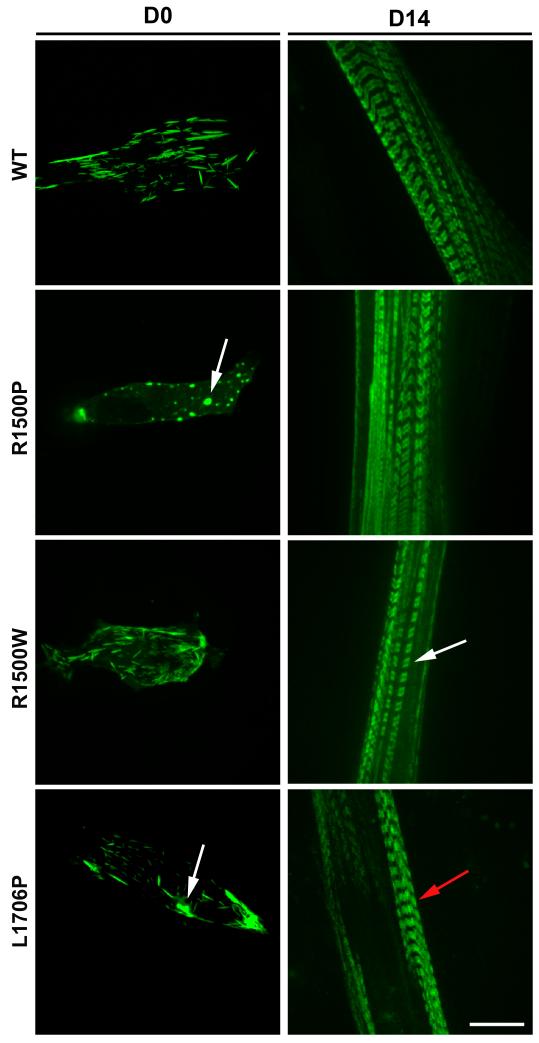
Figure 2.
Analysis of mutants in C2C12 cells. Cells transfected with the WT and mutant GFP-tagged myosin rod constructs as depicted, were imaged 24 h (D0) or 14 days (D14) after transfection. Pictures shown in D0 and D14 do not correspond to the same cell followed over time. Bar, 10 μm. D0 arrows indicate myosin aggregates; D14 white arrow indicates sarcomere bare zone, red arrow indicates mutant accumulation in the bare zone.

