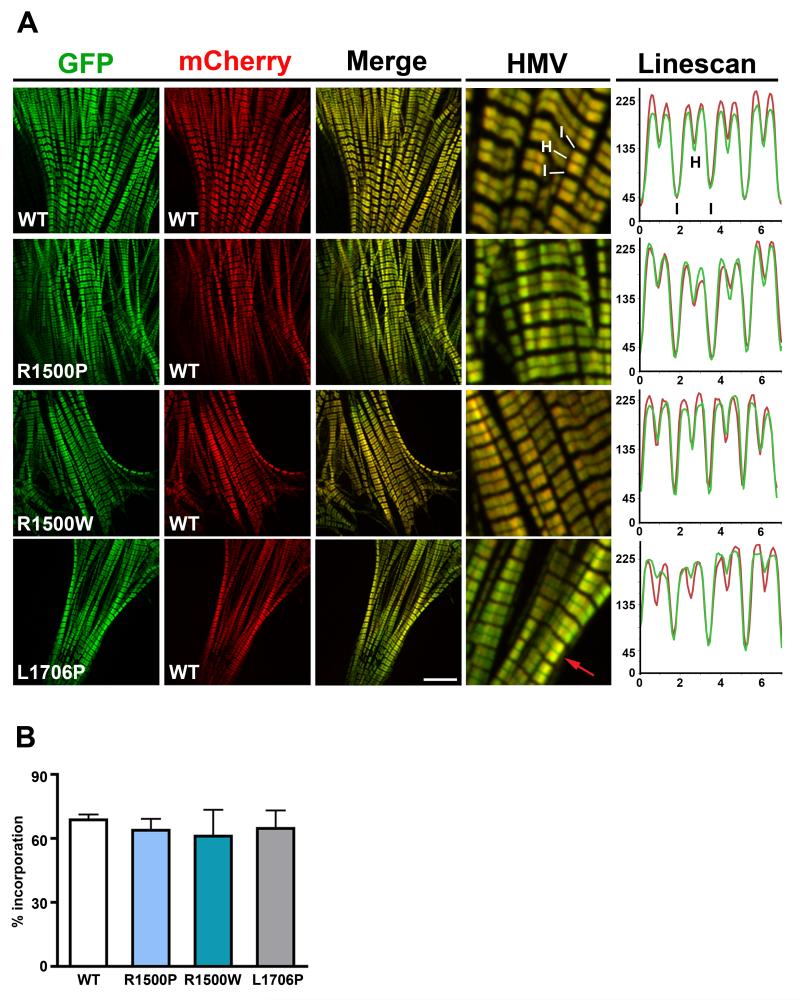
Figure 3.
Analysis of mutants in NRVMs. (A) NRVMs were electroporated with the WT/mutant GFP-tagged and WT mCherry-tagged myosin rod constructs as indicated. Cells were imaged by confocal microscopy 96 h later. HMV: High Magnification View of the merged images; I, I-Band; H, H-zone (bare zone); the red arrow in the L1706P HMV panel indicates the presence of fluorescence in the sarcomere bare zone. Bar, 10 μm. Linescan panels show a typical graphical representation of the fluorescence intensity values of myosin constructs expressing GFP-tagged WT, R1500P, R1500W, L1706P myosin (green line) and mCherry-tagged WT myosin (red line) measured along 4 sarcomeres; x-axis, distance (μm); y-axis, gray levels (avg). (B) The percentage of transfected NRVMs showing organized sarcomeres containing GFP-myosin was scored 96 h after electroporation. Data were obtained from 3 independent transfections and a total of ~ 4000 cells/construct scored blind.

