
Figure 1.
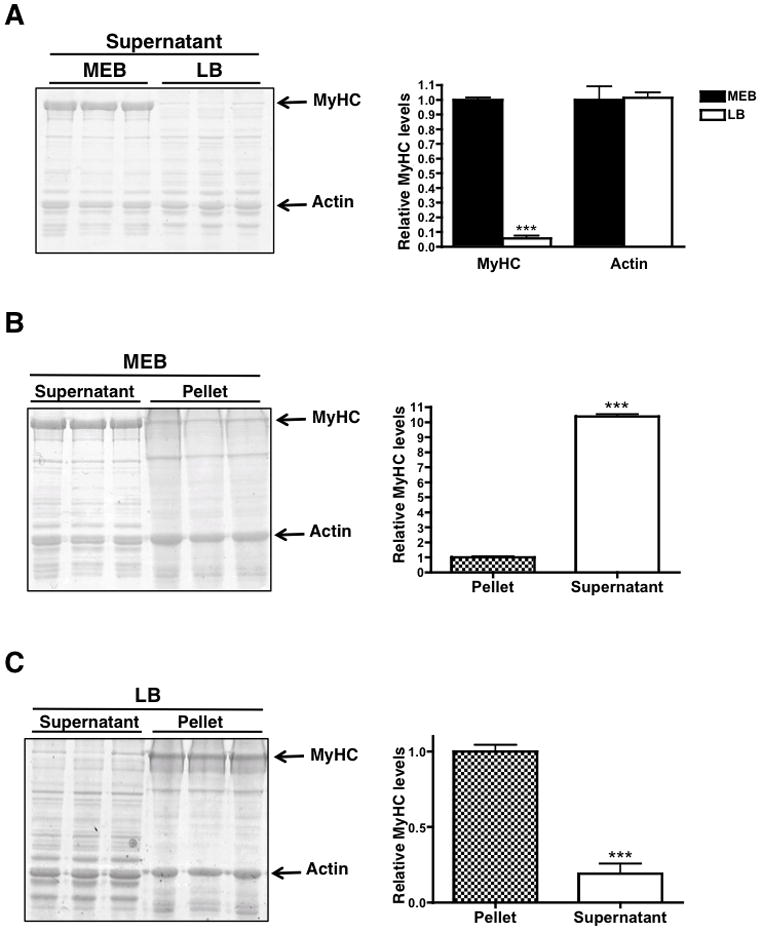
MyHC solubility in high salt myosin extraction buffer (MEB) and low salt lysis buffer (LB). (A) Coomassie-stained myofibrillar gel of the supernatant fraction of tibialis anterior muscle lysed in MEB and LB. 10 μg of protein was loaded for each sample. (B) Coomassie-stained myofibrillar gel of 10 μg of the supernatant and pellet fractions of tibialis anterior muscle lysed in MEB or LB (C). Histograms to the right of each figure represent MyHC and actin quantities in each sample. * p < 0.05, *** p < 0.0001. Graphs are mean ± SEM.