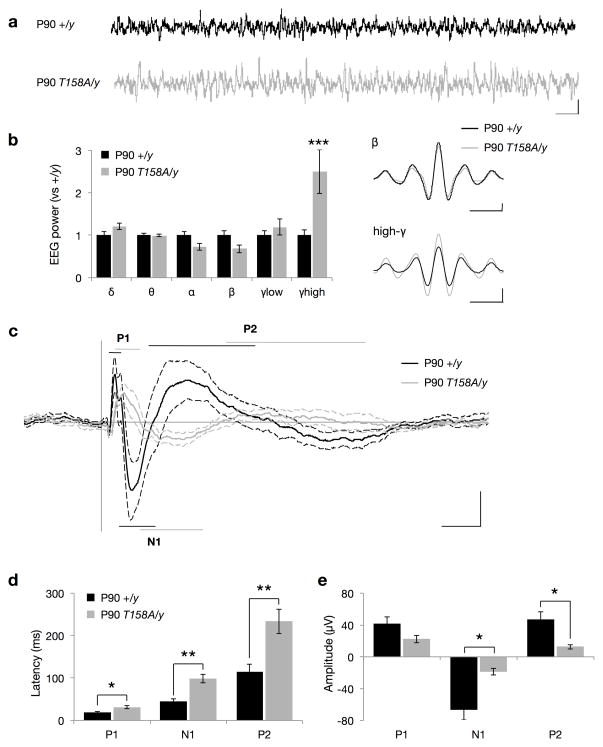
Figure 6. EEG and ERP recordings in MeCP2 T158A mice.
(a) Representative EEG traces from awake, freely mobile mice. Scale bar corresponds to 1 second (horizontal) and 200 μA (vertical). (b) Basal EEG power measurements in P90 Mecp2T158A/y mice (n = 7) compared to Mecp2+/y littermates (n = 8). Frequency bands are represented as follows: δ (2–4 Hz), θ (4–8 Hz), α (8–12 Hz), β (12–30 Hz), low-γ (30–50 Hz), and high-γ (70–140 Hz). Insets show β and high-γ mean amplitudes across EEG recordings. Scale bars represent one oscillation cycle (horizontal) and 20 μA (vertical). Bars represent mean ± SEM. *** p-value <0.001; two-tailed t-test with Bonferroni correction. (c) Grand average event-related potential (ERP) traces following presentation of 85-dB white-noise clicks with 4-second interstimulus intervals. Traces represent mean amplitude (solid line) ± SEM (dashed lines). The characteristic polarity peaks P1, N1 and P2 are highlighted with straight lines with the length indicating latency range. Scale bar corresponds to 50 ms (horizontal) and 20 μA (on vertical). (d) Latencies and (e) amplitudes of ERP peaks. Bars represent mean ± SEM. * p-value < 0.05 and ** < 0.01; two-tailed t-test with Bonferroni correction

