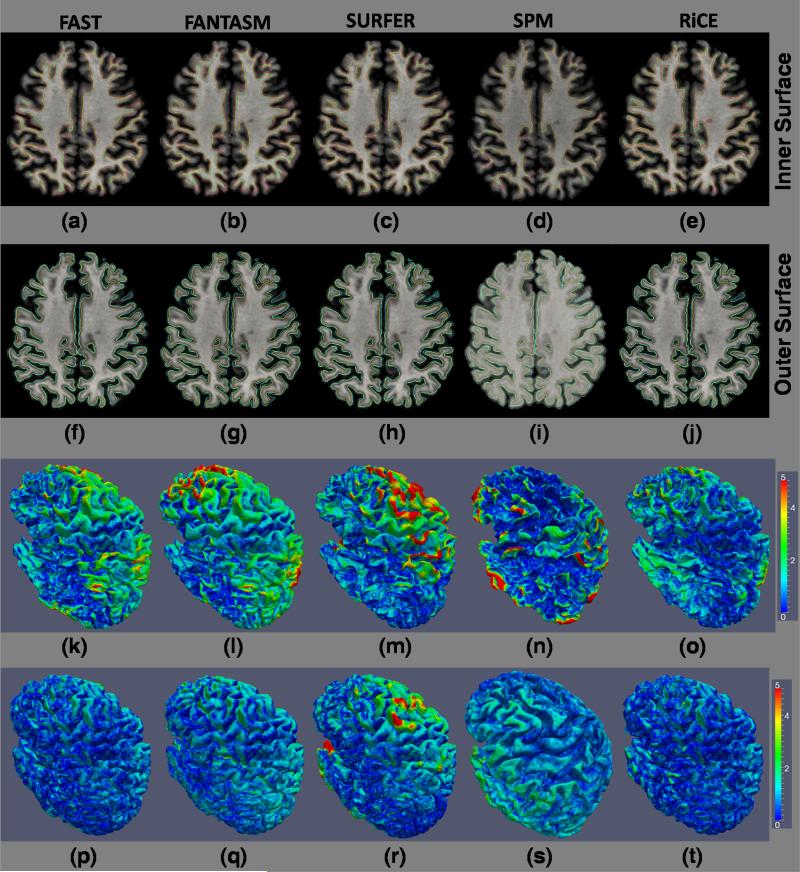
Figure 10.
Surface difference between The cortical surfaces generated from the SPGR and MPRAGE are shown on the MPRAGE image. Inner surface of the MPRAGE (green) and SPGR (red) processed by (a) FAST, (b) FANTASM, (c) Freesurfer (mri_ms_EM), (d) SPM (spm_segment) and (e) RiCE are shown on the MPRAGE. Outer surface of the MPRAGE (yellow) and SPGR (blue) processed by (f) FAST, (g) FANTASM, (h) Freesurfer, (i) SPM and (j) RiCE are shown on the SPGR image. A color map of the absolute difference between the inner surfaces of SPGR and MPRAGEs, obtained from the five algorithms, are shown in (k)-(o). Similarly, the color map of the difference between the outer surfaces of SPGR and MPRAGEs are shown in (p)-(t). RiCE gives overall smaller surface difference (see Table 6).

