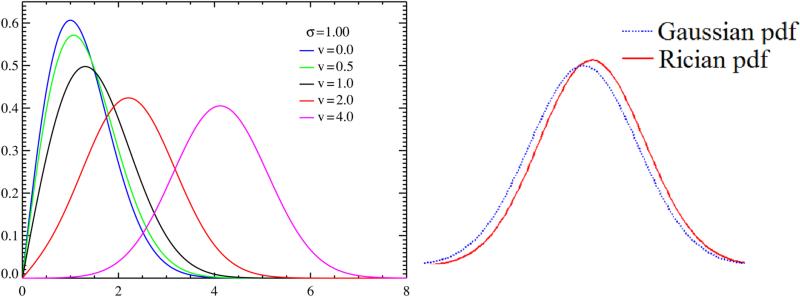
Figure 2.
(a) Rician distribution of y (Sec. 2.1) for different values of v (Wikipedia, 2011), (b) Rician PDF (red) overlapped with the corresponding Gaussian one (blue) for SNR = 2. Clearly, Gaussian approximation of the actual Rician PDF is biased.

