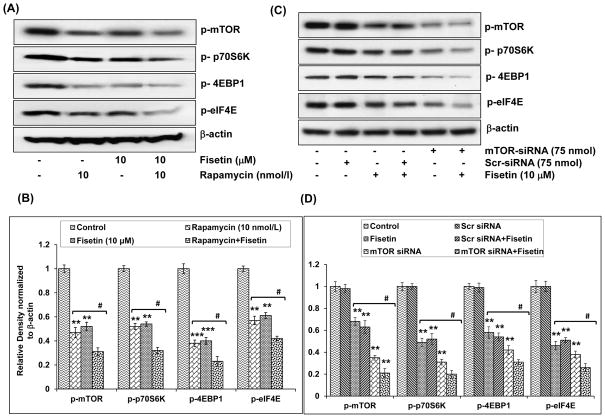
Figure 6.
Effect of rapamycin and mTOR-siRNA on fisetin-induced inhibition of the phosphorylation of mTOR and its downstream targets in A549 cells. A, Effect of rapamycin on fisetin-induced inhibition of the phosphorylation of mTOR, p70S6K, 4EBP1 and eIF4E in A549 cells. Cells were treated with rapamycin (10 nmol/L) for 2 h, followed by addition of fisetin (10 μM; 48h). Whole cell lysate was prepared and 40 μg protein was subjected to SDS-PAGE followed by immunoblot analysis and chemiluminescence detection. Equal loading of protein was confirmed by stripping the immunoblot and reprobing it for β-actin. The immunoblots shown here are representative of 3 independent experiments with similar results. B, Histogram represents relative density data of the immunoblots, from all experiments, shown in relative units ± SEM. Values represent mean ± SEM. *P < 0.05, **P < 0.01 and ***P < 0.001 versus control group. #P < 0.05 versus fisetin-treated and rapamycin-treated groups. C, Effect of mTOR-siRNA on the inhibition of the downstream targets of mTOR in A549 cells. The A549 cells were transfected with mTOR-siRNA (75 nM) or scrambled siRNA (75 nM) and were then treated with 10 μM fisetin for 24 h. Whole cell lysate was prepared and 40 μg protein was subjected to SDS-PAGE followed by immunoblot analysis and chemiluminescence detection. Equal loading of protein was confirmed by stripping the immunoblot and reprobing it for β-actin. The immunoblots shown here are representative of 3 independent experiments with similar results. D, Histogram represents relative density data of the immunoblots shown in 'C' in relative units ± SEM. Values represent mean ± SEM. *P < 0.05, **P < 0.01 and ***P < 0.001 versus control group. #P < 0.05 versus fisetin-treated and mTOR siRNA-treated groups.

