
Figure 3.
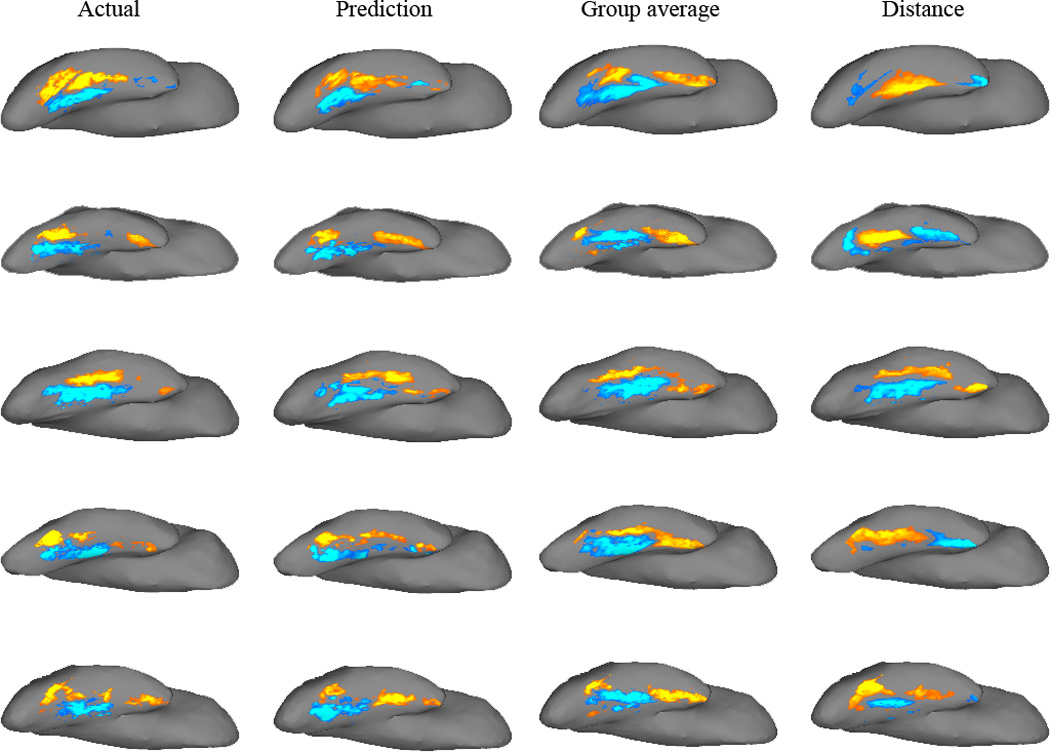
Actual and predicted fMRI activation to Faces>Scenes in the fusiform gyrus of five example participants. For each participant, actual and predicted activation images (t-statistic values for Faces>Scenes) were up-sampled from the DWI structural image (where all the analyses were performed) to the same participant’s structural scan, and projected onto the participant’s inflated brain surface. Each row is a single participant; the leftmost column displays the actual fMRI activation pattern in the right fusiform gyrus. The remaining columns illustrate, from left to right, predicted fMRI images from: connectivity, group-average, and distance.