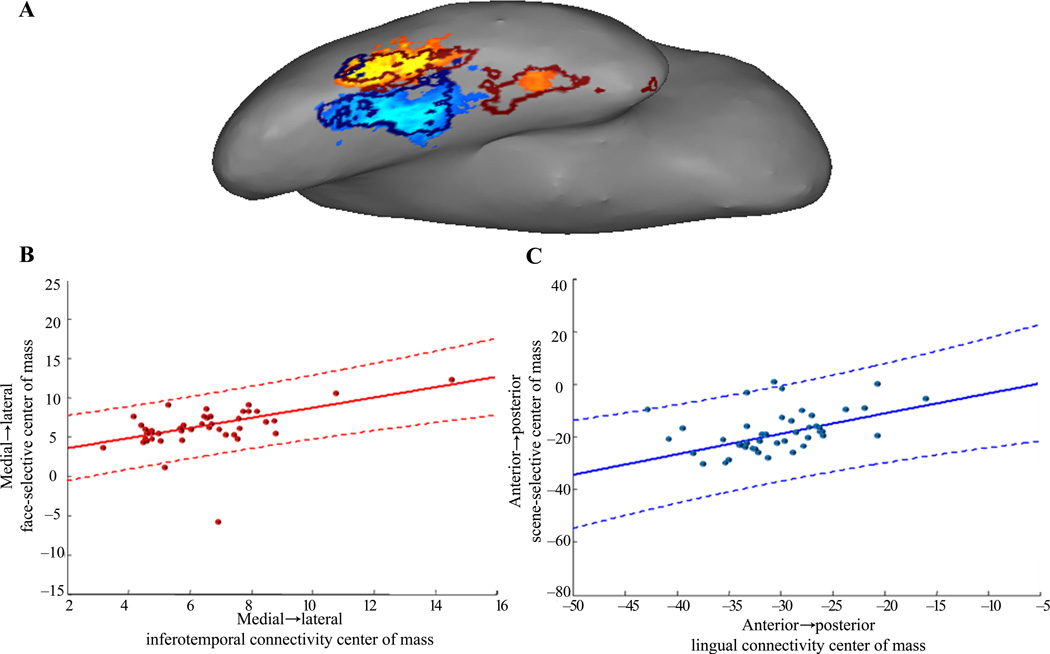
Figure 5. Spatial relationship of function with connection strength to the highest predictors.
(a) Functional activation of an example participant, with the thresholded boundaries of inferotemporal connectivity overlaid in dark red, and boundaries of lingual connectivity overlaid in dark blue. (b) Each participant’s center-of-mass of connectivity to inferotemporal is plotted against their center-of-mass of positively-responding voxels, along the medial-lateral dimension, along which each participant’s connectivity varies alongside face-selectivity. (c) Centroids of lingual connectivity, plotted against centroids of negatively-responding voxels, along the anterior-posterior dimension. Solid lines in b and c are the least-square fits of these data, and dashed lines are their 99% confidence intervals.

