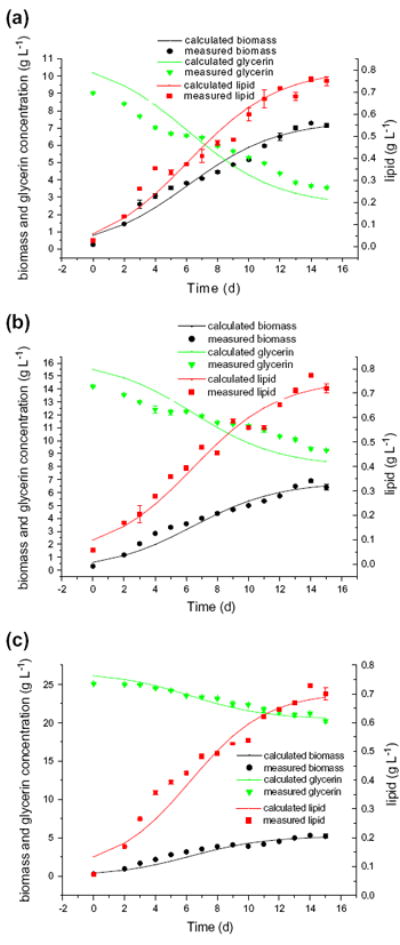
Fig. 3.

Comparison of experimental data and calculated values of biomass, lipid and glycerin consumption by UTEX2341. (■) experimental data of biomass, (▲) experimental data of glycerin, (▼) experimental data of lipid. The curves represent the fitted model equations proposed in this study. Fig. 3(a), Fig. 3(b), Fig. 3(c) corresponds to the three initial glycerin concentrations of 9.02, 14.5 and 25.2 g/L respectively.
