
Fig. 5.
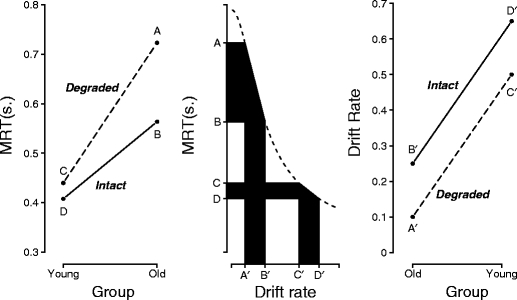
Interaction effects on MRT may correspond to additive effects on drift rate. The left panel shows an interaction effect on MRT in a hypothetical 2 × 2 experiment with young and old participants who are confronted with intact and degraded stimuli. The middle panel shows how mean RT maps onto drift rate, a diffusion model parameter that we assume is uniquely responsible for the observed differences in performance. The right panel shows the corresponding additive effect on drift rate. When comparing the left and right panels, note that short MRTs correspond to high drift rates and vice versa