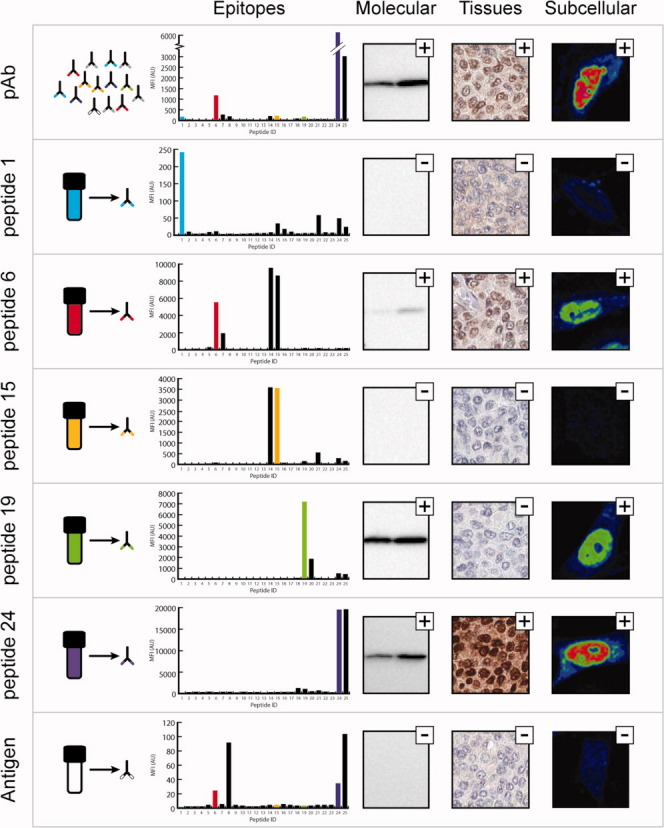
Figure 2.

Generation of monospecific antibodies towards the human RNA-binding protein RBM3. Each panel shows the epitopes, the molecular identification in Western blot (Lane 1: RT-4 cell lysate Lane 2: U-251 MG cell lysate), staining of breast cancer tissue, and subcellular localization in U-251 MG cells (images are shown in a rainbow RGB look up table (LUT) where red indicates strong signal and blue low signal) for the polyclonal serum purified from tag specific antibodies (pAb) targeting RBM3, five monospecific and one conformational antibody purified from the polyclonal sera, respectively. The peptide selected for purification are indicated in the epitope mapping barplots in different colors, where the x-axis represents the peptide ID and the y-axis indicate the mean fluorescence intensity. A small plus indicate the detection of a band of correct molecular mass, the right staining or localization according to literature while a minus indicate aberrant or negative result.
