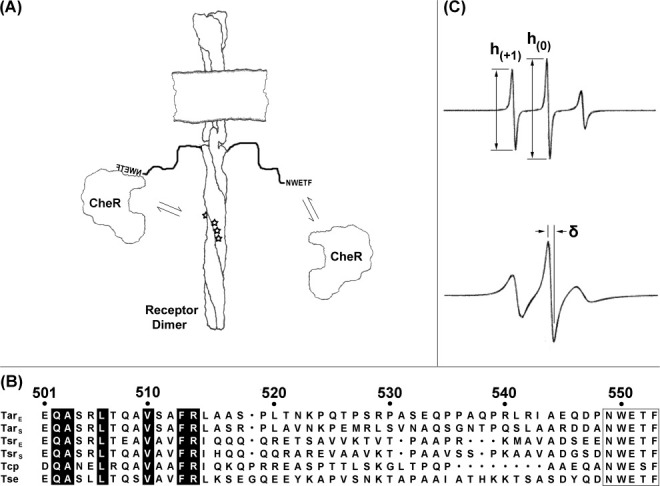
Figure 1.

Chemoreceptors and EPR spectra. (A) Chemoreceptors and CheR. The cartoon shows a membrane-embedded chemoreceptor dimer with its carboxyl-terminal NWETF pentapeptide unoccupied (right) or bound to methyltransferase CheR (left). Equilibrium arrows indicate interactions of pentapeptide and CheR (right) or tethered CheR with methyl-accepting sites (stars; left). (B) Alignment of carboxyl-terminal sequences of pentapeptide-bearing receptors from E. coli and S. enterica. Exact matches for the six sequences are highlighted in black and the NWETF/NWESF pentapeptide is boxed. Position numbers are for E. coli Tar. (C) Example EPR spectra and illustrations of semiquantitative mobility parameters. The figure shows representative spectra of spin labels in an unstructured protein region (upper spectrum) and at a solvent exposed residue in an alpha helix (lower spectrum; spectra from Columbus and Hubbell, Biochemistry, 2004, 43, 7273–7287, © W.H. Freeman, reproduced by permission). The ratio of the low-field to central peak amplitudes (top spectrum) can be used to derive a semiquantitative mobility parameter h(+1)/h(0). The peak to peak width (δ) of the central line (bottom spectrum) is used to calculate the scaled mobility parameter MS (see Materials and Methods).
