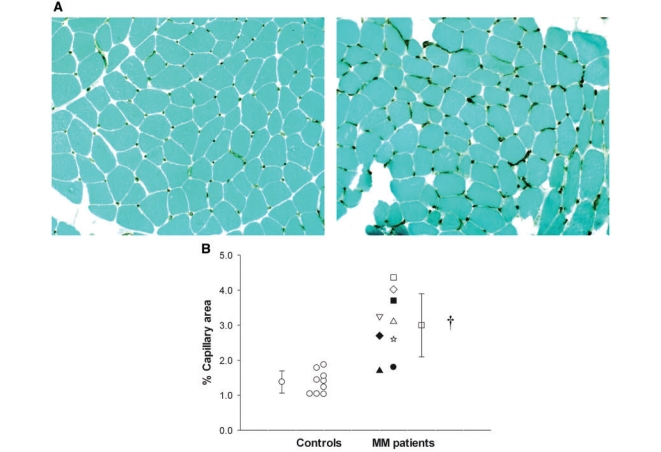
Figure 1.
Capillary levels within skeletal muscle of patients with mitochondrial myopathies compared with healthy, age-matched and sedentary controls. (A) Representative images in a female control (left) and a female patient (patient 9 in Table 1) with mitochondrial myopathy (MM, right), highlighting greater capillary levels (immunostaining utilizing antibody to CD31) surrounding muscle fibres in the patient with mitochondrial myopathy. Images at ×10 magnification. (B) Group means ± SD and the distribution of per cent capillary area in individual controls and patients with mitochondrial myopathy. *P < 0.001. ▴ = Patient 1; • = Patient 2; ☆ = Patient 3; ♦ = Patient 4; △ = Patient 5; ▪ = Patient 6; ▽ = Patient 7; □ = Patient 8; and ◊ = Patient 9.

