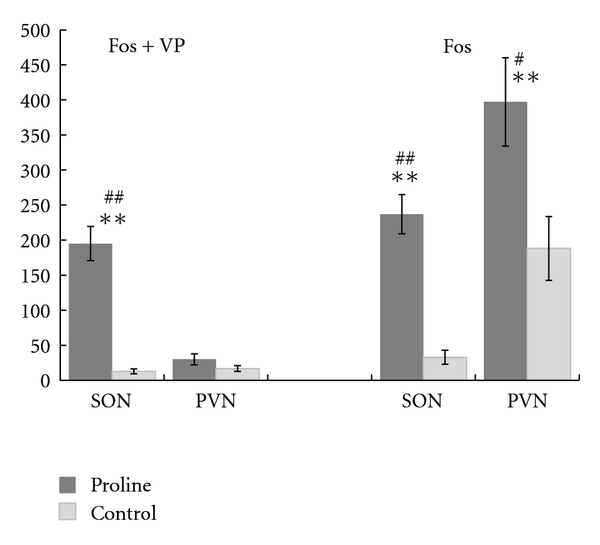
Figure 3.

c-Fos-positive and vasopressin-positive neurons in the SON and the PVN following L-proline or ACSF injection. There were 10 L-proline-injected samples and eight negative control, ACSF-injected samples. “Fos + VP” indicates the number of vasopressin-expressing (VP) neurons with c-Fos stained nuclei. “Fos” indicates the total number of neurons with c-Fos stained nuclei. Data are presented as the means ± SE. **P < 0.01 by t-test. # P < 0.05 and ## P < 0.01 by the Wilcoxon rank sum non-parametric test.
