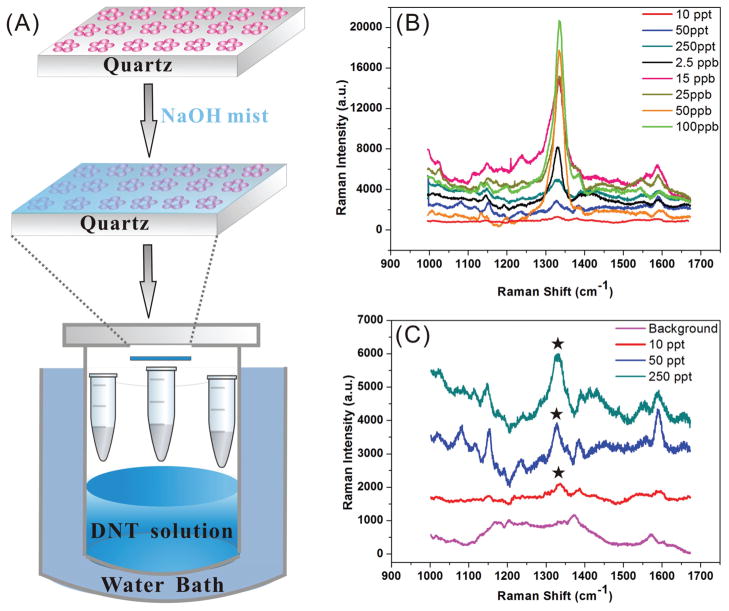
Figure 15.
NCA enabled ultra-trace SERS detection of DNT. (A) Experimental approach: NCAs wetted with NaOH mist are exposed to DNT vapor of a defined concentration; (B) SERS spectra of DNT exposed NCAs as function of DNT concentration (100 ppb – 10 ppt); (C) Magnification of the 150, 50 and 10 ppt spectra as well as the background. The star in (C) indicates the characteristic NO2 stretching mode at 1336 cm−1. Adapted with permission from ref69. Copyright 2011 American Chemical Society.

