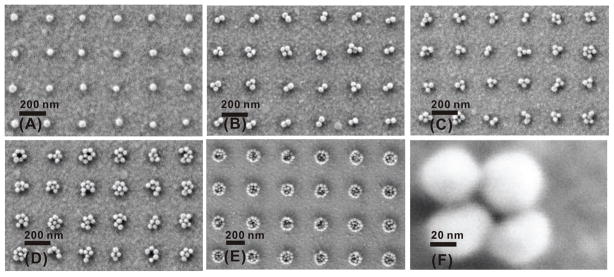
Figure 6.
Collective response engineering: the role of the NP cluster size. SEM images from NCAs assembled with constant edge-to-edge separation (Λ = 200 nm) but varying binding site diameter: D = 50 nm (A), 80 nm (B), 100 nm (C), 130 nm (D) and 200 nm (E). A magnified image of an individual cluster of 40 nm Au NPs is shown in (F). Adapted with permission from ref71. Copyright 2009 American Chemical Society.

