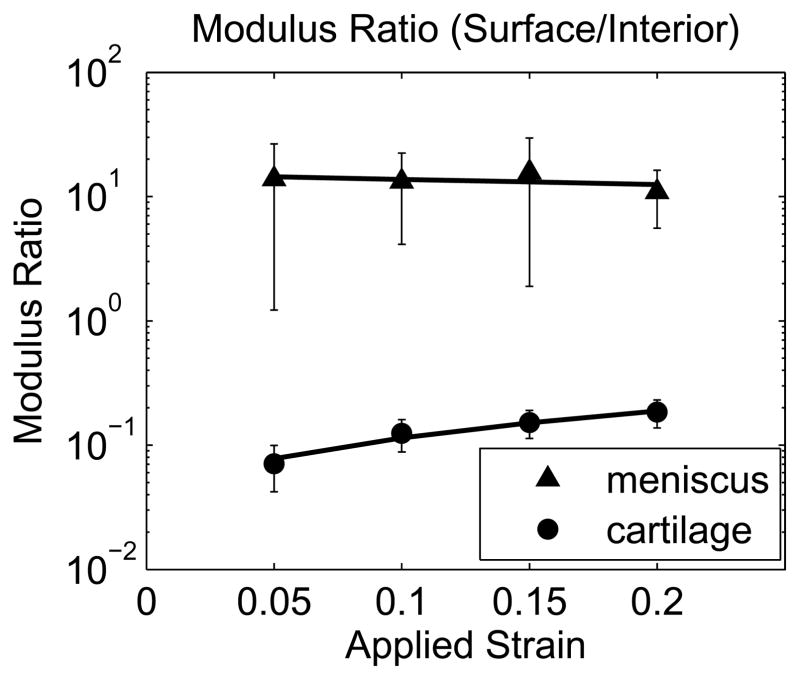
Figure 8.
Representative contour maps of 2D Green’s strain components: normal strain in the direction of (Exx) and transverse to (Eyy) the applied compression and shear strain (Exy) for cartilage (left) and meniscus (right) at 10% εapplied. Cartilage strain patterns were qualitatively consistent across multiple samples, while meniscal strain patterns were highly variable both within and between samples.

