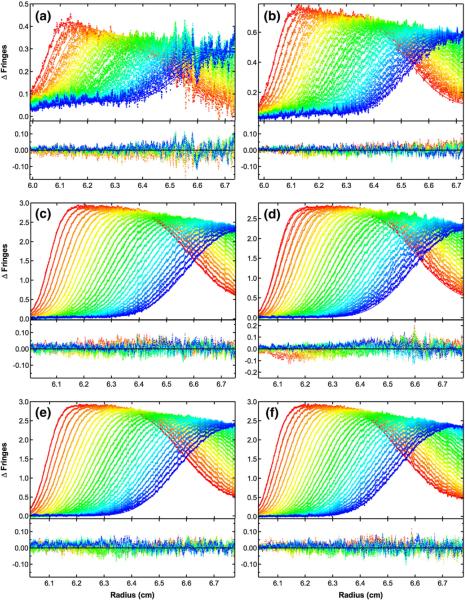
Fig. 6.
Global analysis of sedimentation velocity difference curves for dp8 binding to PKR. The data were subtracted in pairs for six data channels collected at the following concentrations: (a) 2 μM PKR+60 μM dp8; (b) 4 μM PKR+60 μM dp8; (c) 16 μM PKR+60 μM dp8; (d) 16 μM PKR+30 μM dp8; (e) 16 μM PKR+16 μM dp8; (f) 16 μM PKR+8 μM dp8. The data (58 difference scans for each channel) were globally fitted to the binding model depicted in Fig. 4a with an RMSD of 0.0196 fringes. The value of β11 was fixed at 3.82×10⁶ M−1 based on the fluorescence anisotropy competition of bdp8 with dp8; L20 was fixed at 2.48×10³ M−1 from the sedimentation velocity analysis of PKR dimerization; L21 was constrained as the geometric mean of L20 and L22; sdp8 was fixed at 1.17 S from published data36; sPKR was fixed at 3.52 S16; s(PKR)2 was estimated to be 5.0 S based on the sedimentation analysis of the phosphorylated PKR dimer37; s(PKR)2–dp8 was estimated as 5.5 S; and the ratio of s(PKR–dp8)2 to sPKR–dp8 was constrained to be 1.5. The top panels show the data (points) and fit (continuous lines), and the bottom panels show the residuals (points). The best-fit parameters are shown in Table 1. Conditions: rotor speed, 50,000 rpm; temperature, 20 °C; interference optics; scan interval, 1 min.

