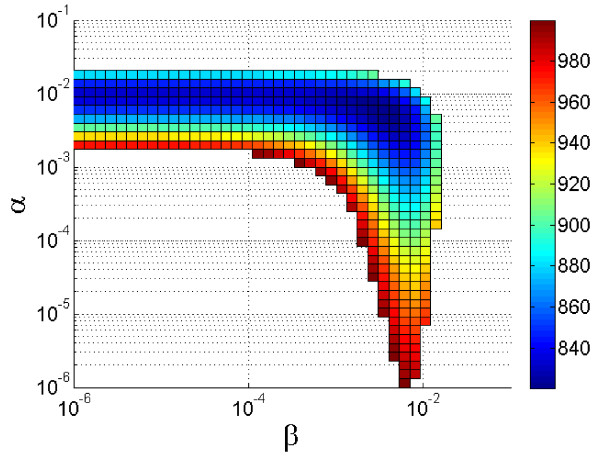
Figure 6.
Sensitivity analysis of alpha (indirect contact) and beta (direct contact). Surface color represents maximum likelihood for the model fit with the real data of LSD outbreak in Ein-Zurim, 2006. Note, that the model is significantly more sensitive to alpha than to beta, primarily around the optimal value.

