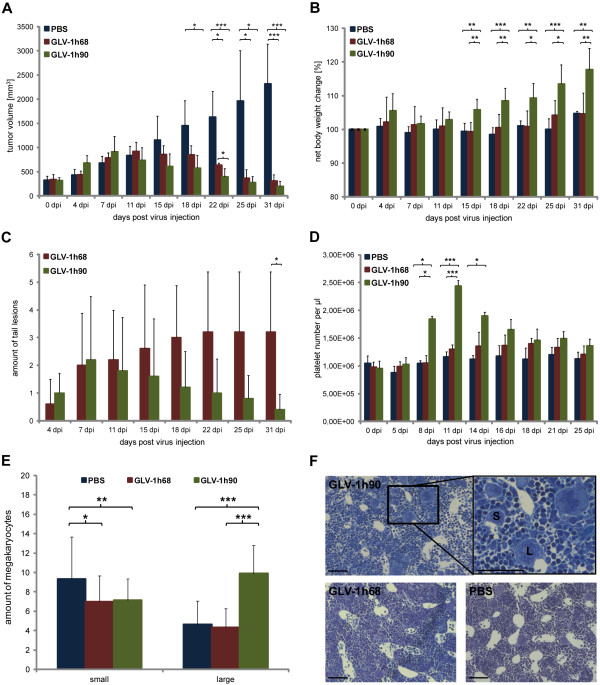
Figure 4.
Effects of GLV-1h90 in a DU-145 xenograft mouse model. (A) Tumor measurements of DU-145 tumor bearing mice injected i.v. with PBS, 5 × 10⁶ pfu GLV-1h68 or GLV-1h90 at 0, 4, 7, 11, 15, 18, 22, 25 and 31 dpi. (B) Net body weight change at the same time points. (C) Quantification of blood platelets in whole blood samples obtained by retro-orbital plexus puncture of PBS-, GLV-1h68- or GLV-1h90-injected mice. (D) Amount of tail lesions was counted over the whole experiment duration. Data represent average plus standard deviation for each group (n = 5). * indicates p ≤ 0.05; ** indicates p ≤ 0.01; *** indicates p ≤ 0.005. (E) Quantification of megakaryocytes of different maturation stages 7 dpi in semi-this sections of the bone marrow. Data represent average of 2 analyzed areas (20 × 22 cm) per section with 5-8 sections per sample (n = 4) plus standard deviation. * indicates p ≤ 0.05; ** indicates p ≤ 0.01; *** indicates p ≤ 0.005. (F) Examples for the analyzed bone marrow sections. S indicates small megakaryocytes; L indicates large megakaryocytes in advanced maturation phases; scale bars indicate 100 μm.

