Figure 5.

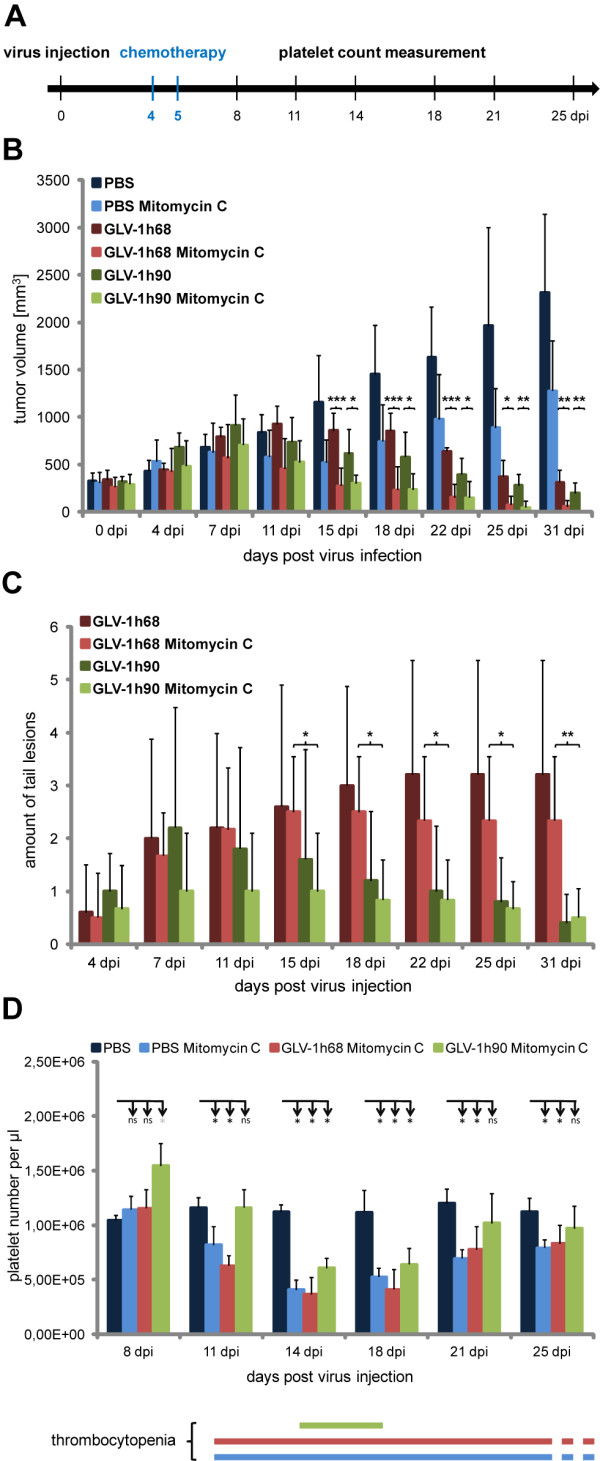
Combination therapy of GLV-1h90 with mitomycin C. (A) Injection schedule. (B) Tumor growth curve of DU-145 tumor bearing mice injected either with PBS, 5 × 10⁶ pfu GLV-1h68 or GLV-1h90 alone or in combination with mitomycin C. Tumor volume was measured at 0, 4, 7, 11, 15, 18, 22 and 25 dpi. (C) Amount of tail lesions was counted starting 4 dpi, the time point when they occurred. (D) Quantification of blood platelets in whole blood samples of mice injected with PBS alone as well as of mice injected with PBS, GLV-1h68 or GLV-1h90 each in combination with mitomycin C at 8, 11, 14, 18, 21 and 25 dpi. The lower panel shows duration of thrombocytopenia in mice treated with mitomycin C. Thrombocytopenia is defined by a significantly decreased platelet number in relation to PBS-injected mice. Data in B, C and D represent average plus standard deviation for each group (n = 5). * indicates p ≤ 0.05; ** indicates p ≤ 0.01; *** indicates p ≤ 0.005; ns not significant.
