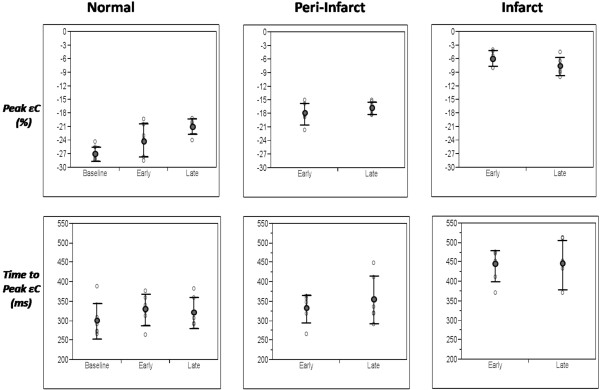
Figure 4.
Scatter plots illustrating peak strain (eC) and time to peak strain (TTP) at baseline, early and late post-MI time-points for normal, peri-MI and MI segments. MI segments demonstrate low strain and delayed mechanical activation at early and late post-MI time-points. Peri-MI segments demonstrate reduction in eC with no significant delay in TTP at both time-points.

