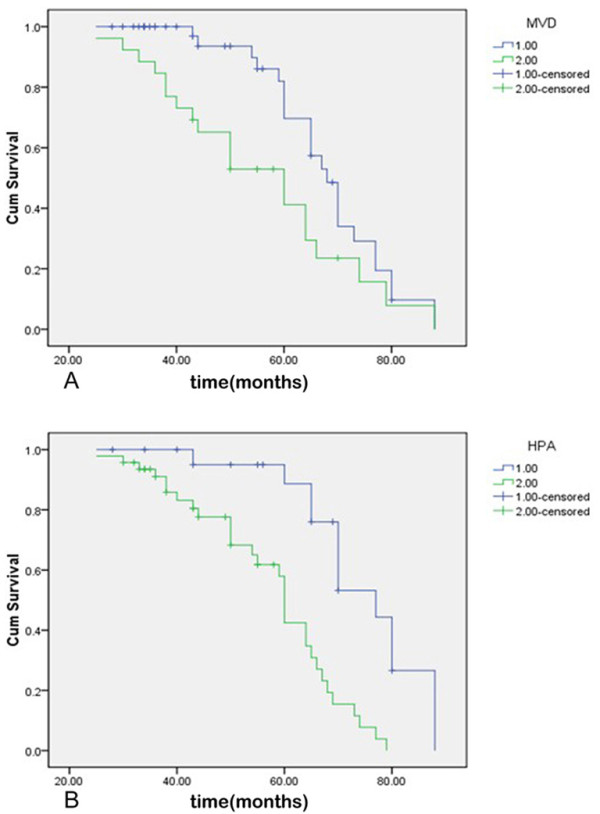
Figure 2.

Survival Curves of the Patients with ccRCC. (A) on the basis of MVD counts in tumor tissues, 1: low MVD group, 2: high MVD group (B) on the basis of HPA expression in tumor tissues, 1: negative expression group, 2: positive expression group.
