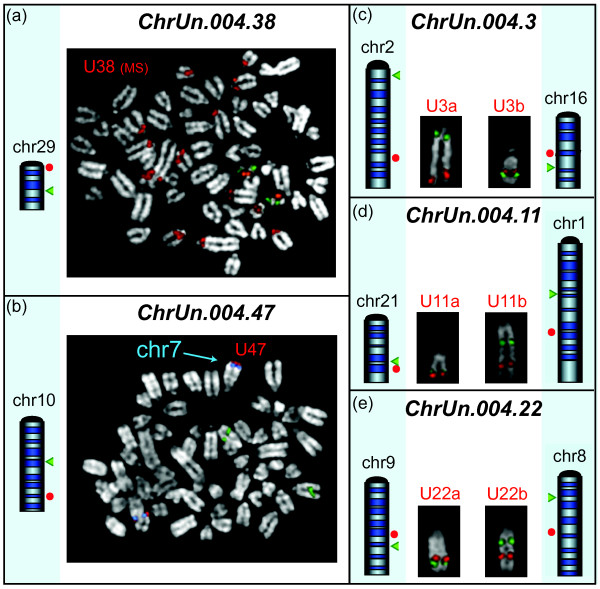
Figure 3.
Examples of FISH experiments of five unassigned Btau scaffolds. The red dots beside the ideograms graphically indicate the mapping, in UMD, of the sequence spanned by the BACs selected for the Btau ChrUn under study (Additional Files 8 and 11). The green arrowheads indicate the position of the chromosome-specific reference BACs. The FISH images show the results of (a) BAC U38 producing multiple signals in disagreement with the UMD single position on chr29 and (b) BAC U47 yielding signals on chr7 and not on chr10 as reported in UMD. (c, d, e) FISH results shown for BACs U3a/U3b (ChrUn 004.3), U11a/U11b (ChrUn 004.11), and U22a/U22b (ChrUn 004.22) supporting the UMD mapping (for detail see text).

