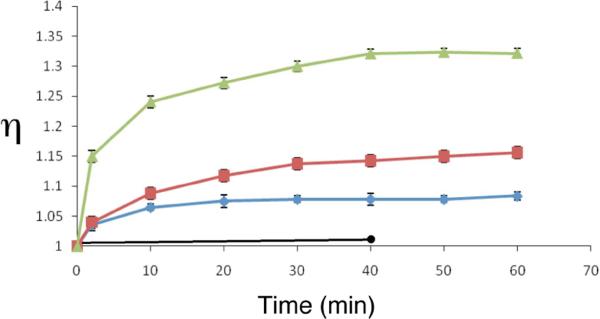
Figure 6.
Time-dependent changes in the relative viscosity a DNA-containing solution treated with various concentrations of activated leinamycin or leinamycin alone. In a typical experiment involving activated leinamycin the final concentrations were: 10 mM sodium phosphate buffer, pH 7; 1 mM bp calf thymus DNA; 0.72 mM of 2-mercaptoethanol; 10% (v/v) acetonitrile; in 1 mL final reaction volume. The upper (green) trace corresponds to 500 μM activated leinamycin, the middle (red) trace 240 μM activated leinamycin, the next lowest (blue) trace 120 μM activated leinamycin and the lowest (black) trace corresponds to 125 μM of the parent unactivated leinamycin. At various times the viscosity of the solutions were measured using an Ostwald-type flow viscometer (2 mL capacity) at room temperature. Relative viscosity of the solutions is reported as η = (t − t0)/t0, where t is the flow time of the DNA-containing solution and t0 is the flow time of buffer.

