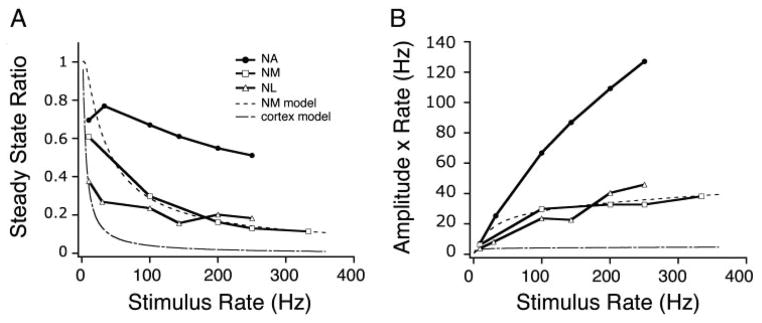
FIG. 8.
A: comparison of steady-state synaptic transfer functions for different auditory brain stem nuclei. ●, NA (from Fig. 6; n = 34); □, NM (n = 3); △, NL (n = 6). Also plotted are simplified, depression-only models using parameters from a fit to NM data (- - -) and from previously published cortical data (– · –; see METHODS). B: total postsynaptic conductance, per unit time (calculated as the product of the steady-state amplitude and stimulus rate) vs. stimulus input rate. Synaptic inputs to NA neurons transmit the presynaptic firing rate linearly and with a greater gain than depressing inputs to NM or NL. Symbols as in A.

