Figure 3.

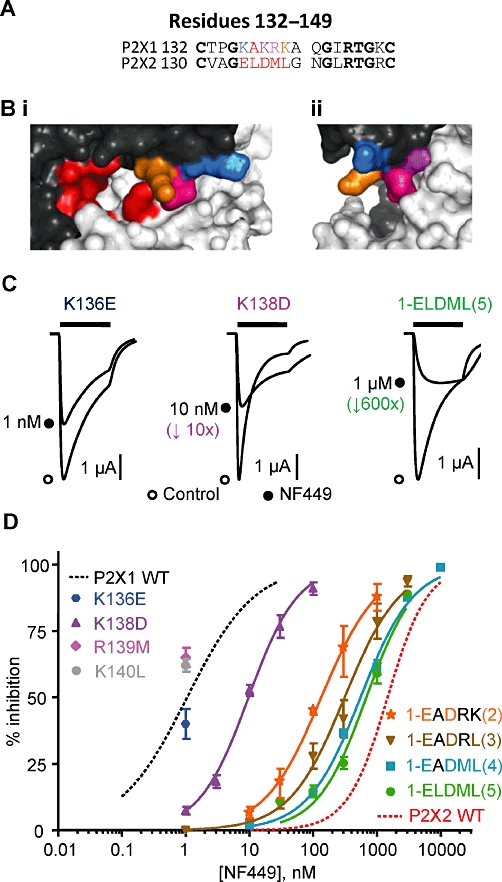
NF449 sensitivity at P2X1 receptor mutants. (A) Sequence alignment of the residues 132–149 in the P2X1 and P2X2 receptor (P2X1 numbering). (B) Homology model of the P2X1 receptor zoomed in on the head region showing the location of the proposed ATP-binding pocket in red and the charged residues K136 (blue), K138 (purple), R139M (pink) and K140L (orange). (C) Inhibition of ATP-evoked currents (EC90 concentration of ATP) in the absence (control) and presence of NF449 (∼IC50 concentration). NF449 was applied 5 min before the application of ATP and then co-applied with ATP. (D) NF449 concentration-dependent inhibition curves of the P2X1 receptor mutants (against an EC90 concentration of ATP). WT P2X1 and P2X2 receptor responses are shown with dotted lines for comparison (n = 3).
