Figure 6.

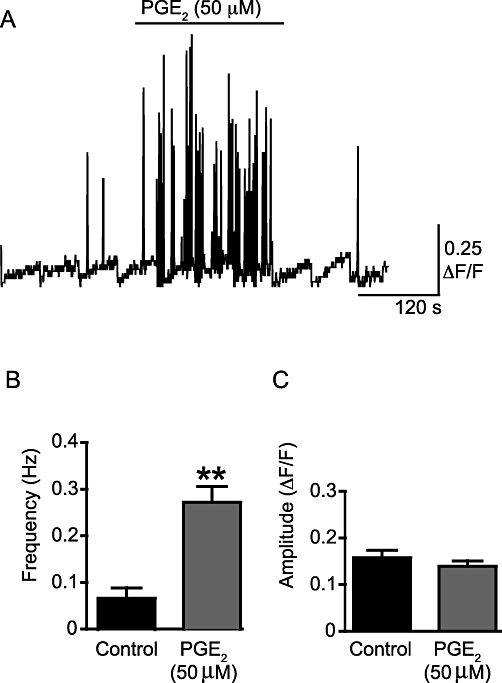
PGE2 increases the frequency of WCTs, but not their amplitude. (A) A sample trace of the frequency of WCTs. This trace is a concatenated composite of shorter 19.8 s recording segments taken every minute. The scale bar indicates the time over the whole experiment so is not valid within each segment. The trace shows the presence of WCTs under control conditions and after addition of PGE2 (50 µM). The positive-going spikes on the trace are WCTs, shown throughout the course of an experiment for a typical preparation; slow changes in the baseline represent focal plane drift while imaging and are hence an artefact of this non-ratioable Ca2+ indicator. (B) The effect of PGE2 (50 µM) on WCT frequency. (C) The effect of PGE2 (50 µM) on WCT amplitude. **P < 0.01.
