
Figure 3.
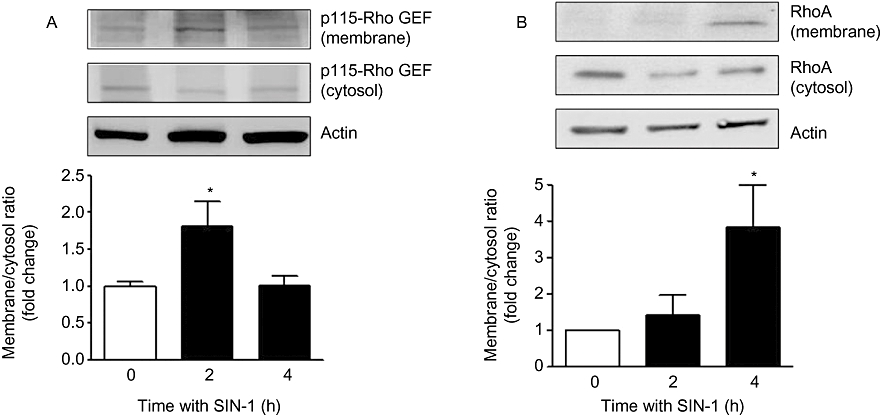
Effect of SIN-1 on p115-Rho GEF and RhoA in BAEC. Cells were treated with SIN-1 (25 µM) for 2–4 h and analysed for p115-Rho GEF (A) and RhoA (B) protein in membrane and cytosolic fractions. Densitometric values were normalized to actin. Ratio of p115-Rho GEF and RhoA expression in membrane to cytosolic fraction was calculated and represented as fold change over control in the histogram. Data represent mean ± SEM from four independent experiments. *P < 0.05 represents SIN-1 versus control.